Last summary report
SightBTC AI current build and observed result snapshot
This report demonstrates how SightBTC AI can document current prototype output and observed trading evidence. It is not a verified performance report, investment advice, or a guarantee that future high-confidence signals will be correct.
Current prototype output
How the current signal looks right now
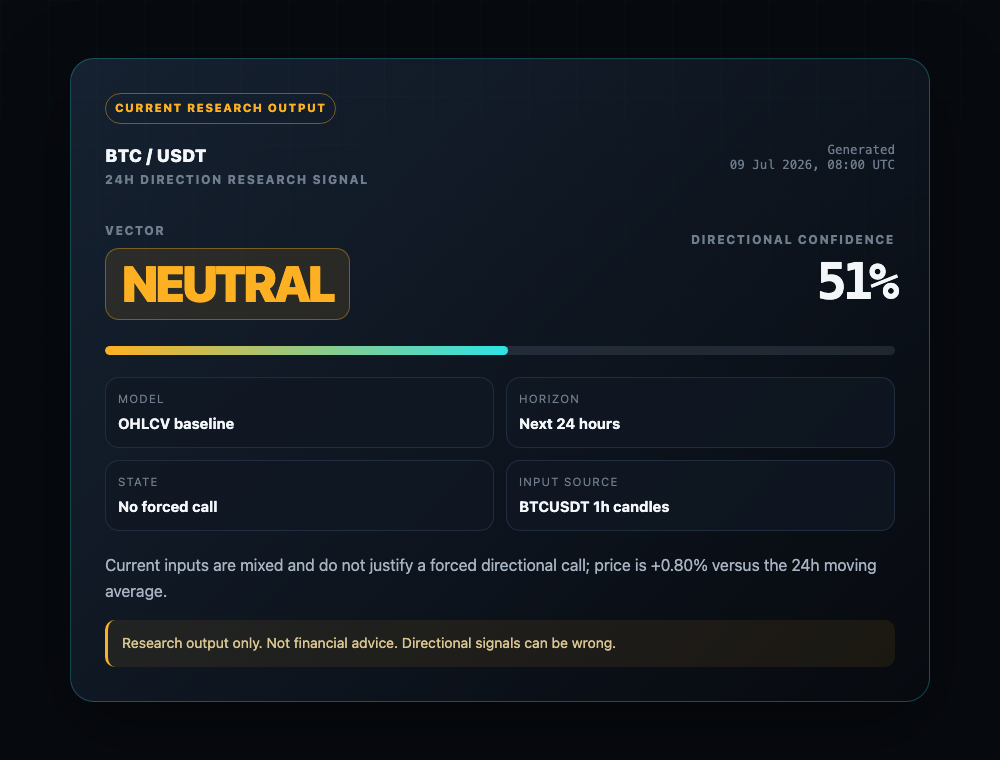
The lightweight research script reads BTCUSDT 1h OHLCV data and produces three fields for the product experience: vector, confidence, and short reasoning. The current sample stays neutral because the model inputs are mixed.
Observed case
MEXC event-trades result window
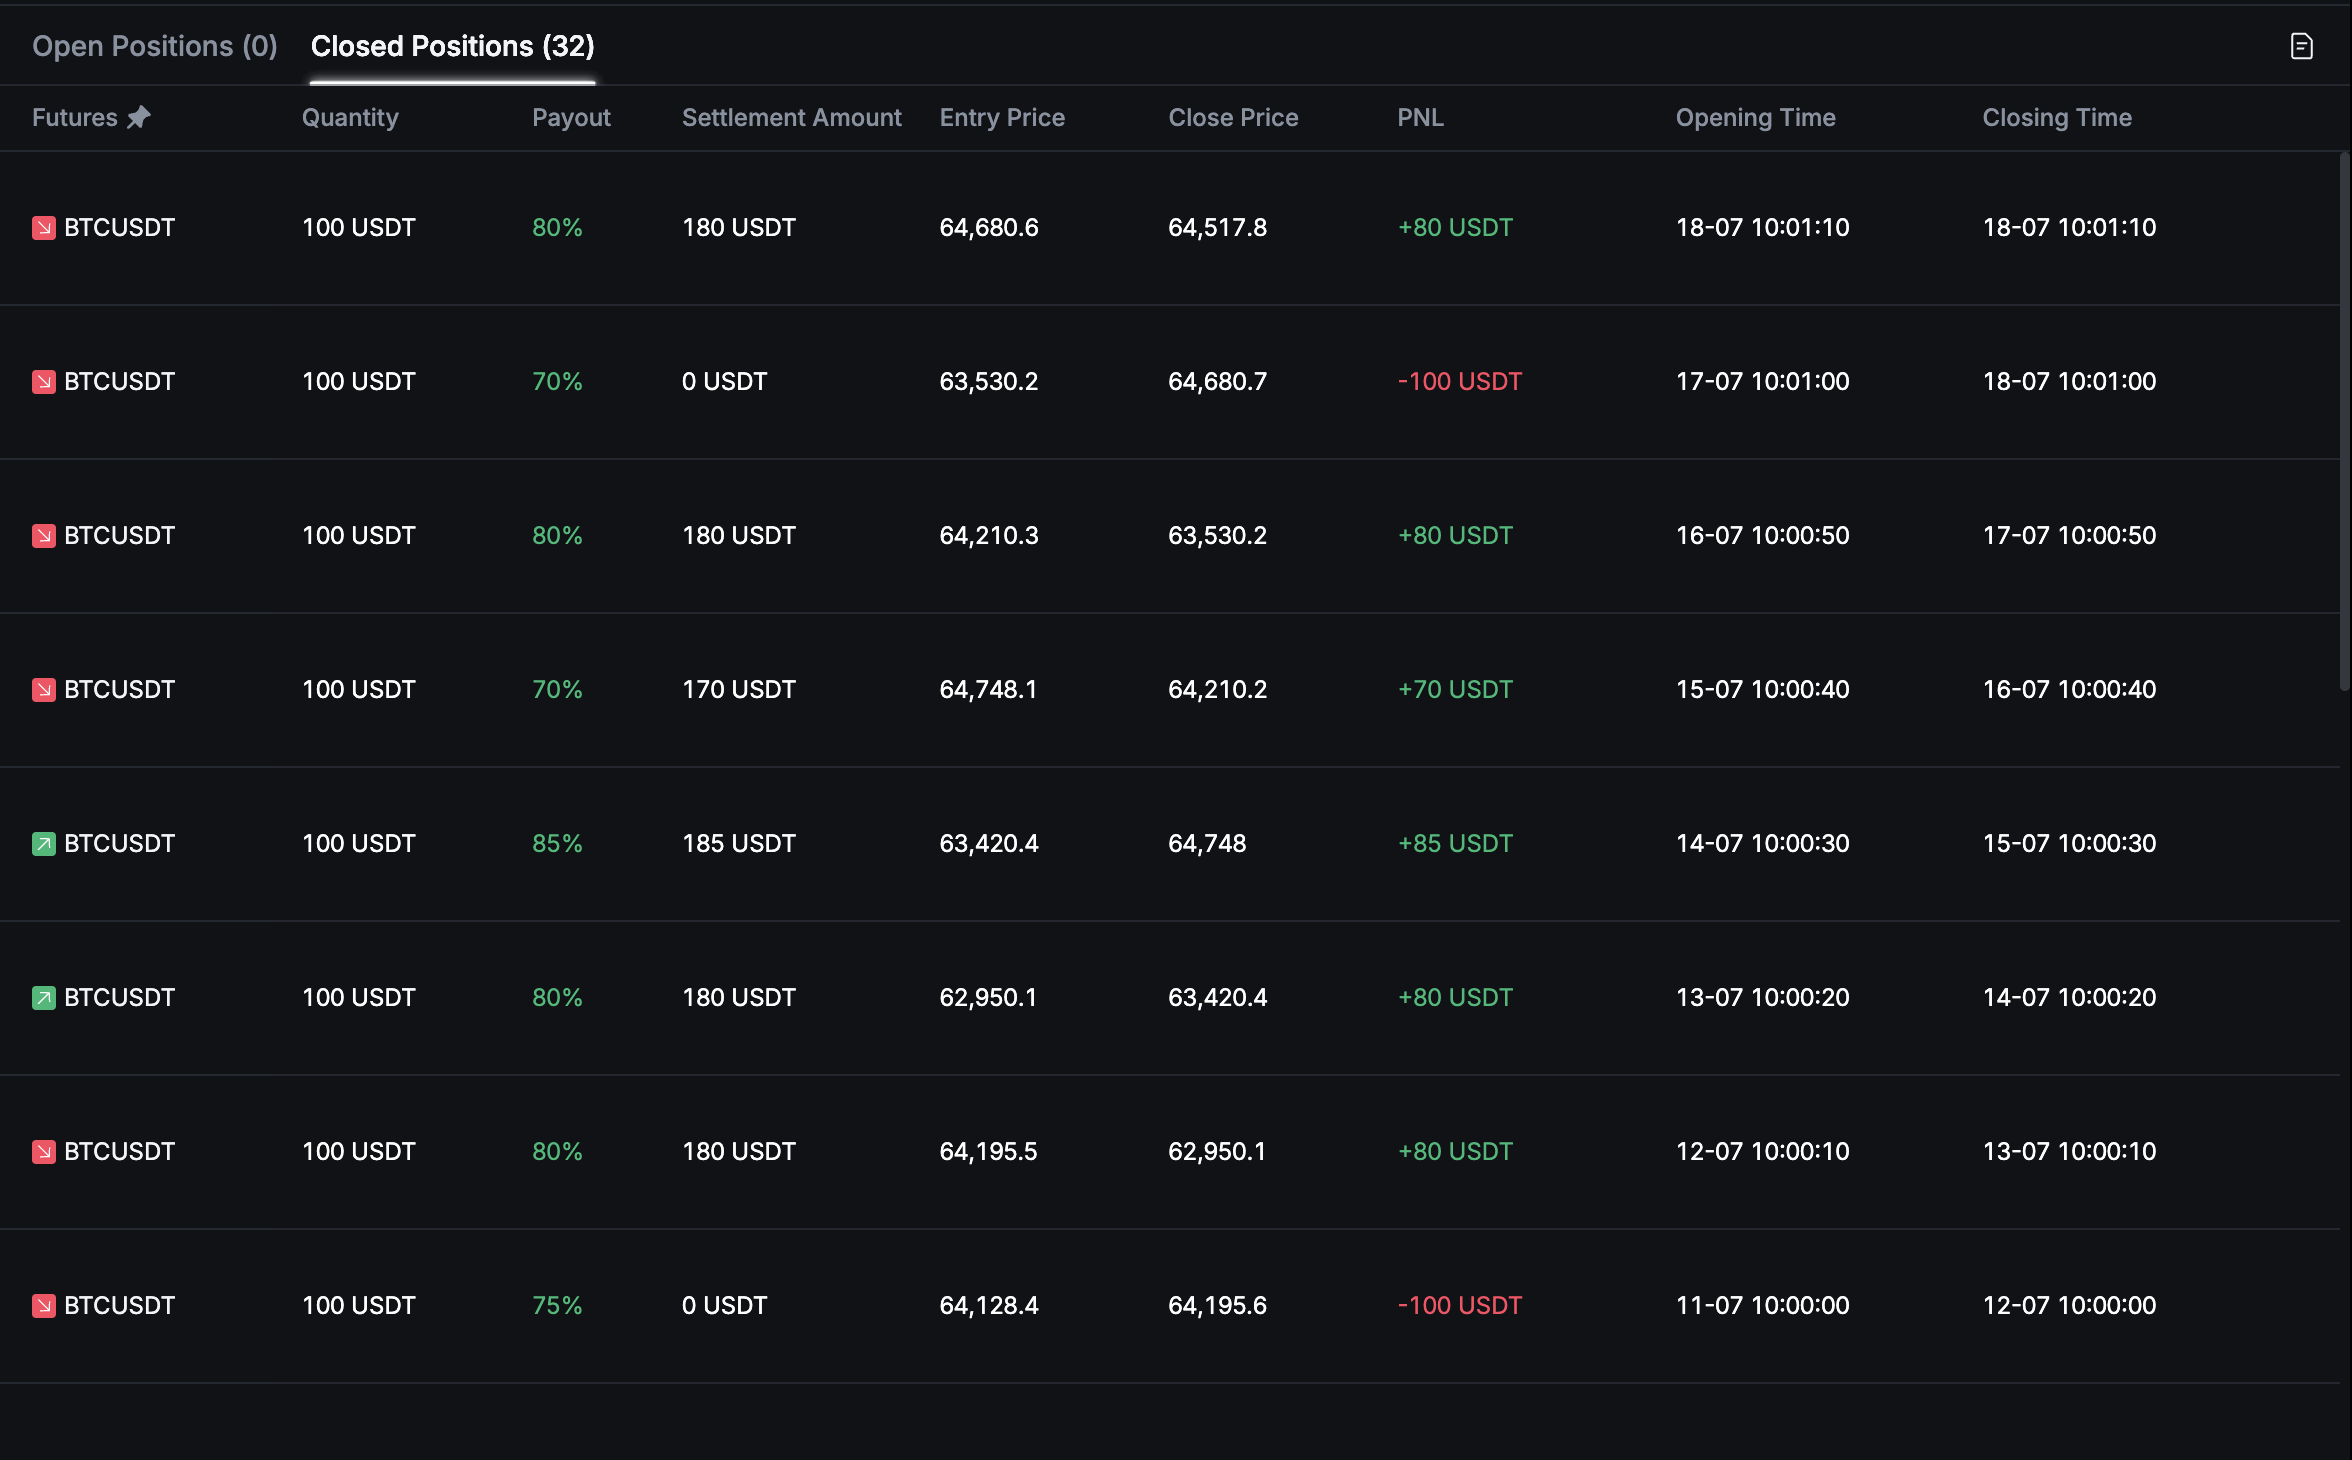
This case shows how a dated evidence artifact may be included in future reporting. The screenshot can support the product story, but complete signal logs, entry rules, timestamps, and independent validation are required before making any public performance claim.
Signal ledger reconstruction
How the MEXC rows could be documented
This table is a product-report mock that assumes the MEXC orders were placed from SightBTC AI outputs. It illustrates the evidence format the product should keep for every signal: timestamp, direction, confidence, reasoning, and result.
| Date / Time | Direction | Confidence | Reasoning | Result |
|---|---|---|---|---|
| 11.07.2026 10:00:00 | Down | 48% | 1h pattern suggests possible trend reversal, but confirmation is weak. | Fail |
| 12.07.2026 10:00:10 | Down | 73% | 4h trend suggests continuation of the downside move after failed recovery. | Success |
| 13.07.2026 10:00:20 | Up | 80% | MEXC row shows a long position opened at 62,950.1 and closed at 63,420.4. | Success |
| 14.07.2026 10:00:30 | Up | 85% | MEXC row shows continued upside from 63,420.4 to 64,748.0. | Success |
| 15.07.2026 10:00:40 | Down | 70% | MEXC row shows a downside position from 64,748.1 to 64,210.2. | Success |
| 16.07.2026 10:00:50 | Down | 80% | MEXC row shows downside continuation from 64,210.3 to 63,530.2. | Success |
| 17.07.2026 10:01:00 | Down | 70% | MEXC row shows the downside position closed against the call at 64,680.7. | Fail |
| 18.07.2026 10:01:10 | Down | 80% | MEXC row shows a downside position from 64,680.6 to 64,517.8. | Success |
Reporting standard before public claims
Future summary reports should include the exact generated timestamp, model version, input data source, signal direction, confidence, reasoning, result after the 24-hour window, and whether the signal met the publication threshold. Screenshots are useful context, but they should not replace a timestamped signal ledger.